
To start off my first post, I wanted to keep it simple with a goofy idea I had a week ago. I wanted to design a perfectly optimized intersection, accounting for cost, safety, and more. After speaking to my calculus teacher we came up with a few rules to dictate this intersection. What follows is my attempt at a perfect intersection, enjoy!
Initial Proposed Plan
- Goals:
- Enhance the safety of pedestrians and cyclists.
- Improve traffic flow efficiency.
- Reduce vehicle emissions.
- Block Layout:
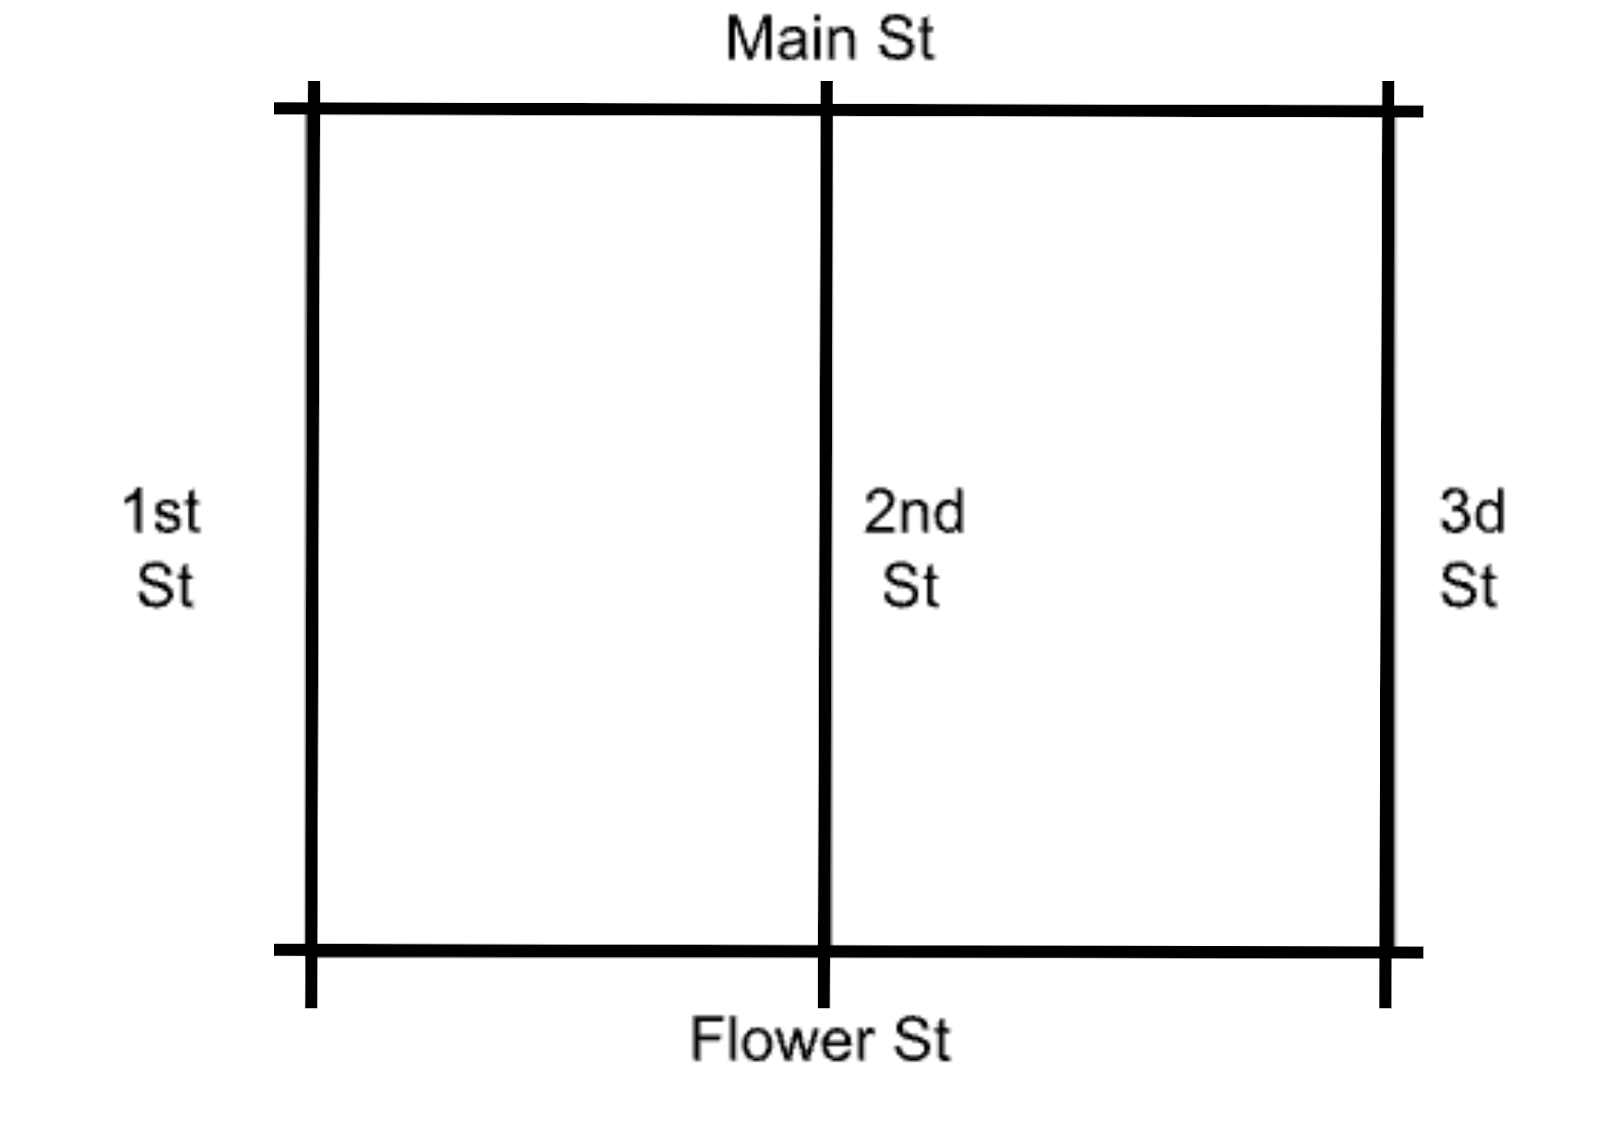
- Main St. intersects with 1st St., 2nd St., and 3rd St.
- Flower St. runs parallel to Main St. and intersects with 1st St., 2nd St., and 3rd St.
- Proposed Measures:
- Intersection: Main St. with first and third street and Flower St. with first and third street.
- Traffic Signal with Timing Optimization:
- Install traffic lights with smart timing to reduce vehicle idling and improve traffic flow.
- Synchronize signals with those at 1st St. and 2nd St. to create a “green wave” for smoother traffic movement.
- A green wave describes how multiple traffic signals coordinate with each other to give a green light to cars coming from a certain direction at the same time to minimize the amount of time a car would need to wait in traffic.
- Advanced Stop Lines – Create advanced stop lines for cyclists to wait ahead of vehicles at red lights.
- Pedestrian Crossings:
- Mark zebra crossings with clear signage and road paint.
- Add curb extensions to shorten crossing distance
- Traffic Signal with Timing Optimization:
- Intersection: Main St. & 2nd St. and Flower St. & 2nd St.
- Stop just on 2nd street– Install stop signs to manage traffic and make sure main street can operate at full speed while limiting the smaller amount of traffic coming from 2nd street
- Pedestrian and Cyclist Infrastructure:
- Add dedicated bike lanes leading up to the intersection.
- Implement pedestrian crossings to slow down vehicle speed.
- Traffic Calming Measures – Used speed bumps and a stop sign with lights on it before the intersection to ensure vehicles approach slowly.
- Intersection: Main St. with first and third street and Flower St. with first and third street.

Methodology
As city planners there are a few steps that we want to take for addressing this issue – gathering data on how efficiently stop signs and traffic lights regulate traffic, understanding the costs to make sure that we do not go over budget, and figuring out what maximizes pedestrian safety. For the purposes of maintaining traffic flow around this city block, we are also going to assume the streets go beyond the block as shown in the image below.
Data Collection
From out point of view as city planners here is how we would collect our data:
- Cost:
- Traffic Light(smart)
- Our research shows that these traffic lights cost 550,000$ per 4 way intersection as per insight from Jaime Rodriguez Co-Founder at Smart City Signals
- Stop Signs
- For the model we found, a cheap stop sign would cost 42 $
- Curb extensions
- Curb extensions are made from cement meaning that the cost for them depends on the amount of cement that we use.
- Assuming that each intersection is 10 meters long, and we want pedestrians to only walk for 7.5 meters, each curb extension would have to be 1.25 meters long. If we add a height of .06 m(height of a curb) and a width of 1.29 meters(width of crosswalk) and use 250$ as the price of a cubic concrete meter we reach the conclusion that each curb extension would cost about 24.19$ – (1.25*1.29*.06) * (250).
- Speed bumps
- Speed bumps are made of asphalt – which currently sits at 160$ per square yard for high quality long lasting asphalt.
- Assuming the dimensions in the image and the function y1, which describes the height of the speed bump in yards at any value of x between 0 and .5, we can use calculus to find out the cost of each speed bump.
- By finding the area under the curve by taking the integral of y1() and then multiplying it by the length of the speed bump which is 4 yards long we get the total volume for a speed bump as 0.2592616 yards (0.0648154 * 4), meaning the cost is about 41.49$ (0.2592616 * 160) per speed bump.
- Bike lanes
- Finally, the bike lanes themselves are made with paint and small short poles which give the bikers extra protection. In this case we will use the assumption that each bike lane will be 1.5 meters in width and will have a length of 200 meters between each intersection(even though we see that the distance between intersections is uneven we are simplifying it).
- With paint per gallon costing 37.98$ and following diagram below for the paint process for a bike lane, we can find that we will need 299.034291 ((197 * 1.5) + (1.5 * 1.5 * pi/2)) m^2 of paint for each bike lane. Since each gallon of paint can cover 37 square meters, that means we will need about 8 gallons of paint per bike lane, meaning each bike lane will cost 306.954$. Since there will be a total of 10 lanes (2 lanes per road for 5 roads) it will cost a total of 3069.54$ for the paint for all the bike lanes.
- Furthermore, assuming that each pole is 1 meter apart from each other and the poles cost 147 dollars each, we would need a total of 198 poles per bike lane. This would amount to 29106$ for all the poles per bike lane.
- Together we would have to pay 29412.95$ for each bike lane. Considering that we have 10 bike lanes the total cost for poles and paint for every bike lane would be 294129.55$ for all the bike lanes.
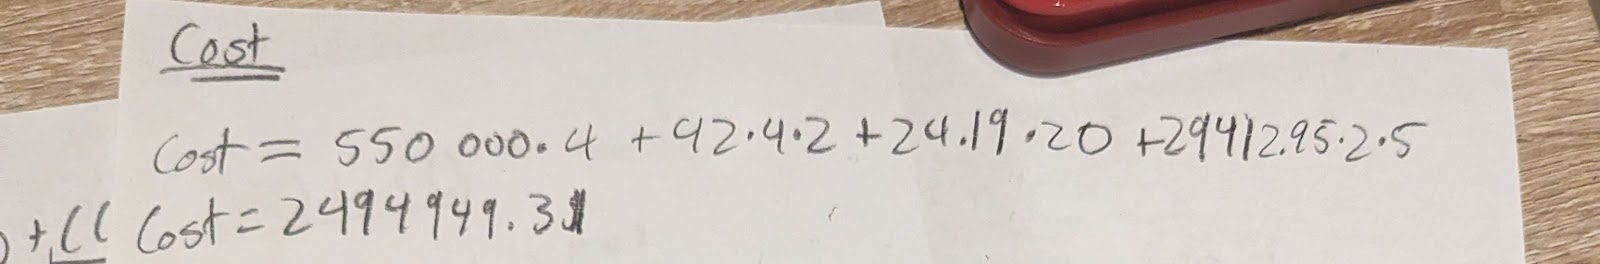
- Equation for cost → C = 550,000 * #traffic signal intersections + 42*4*2#stop signs + 24.19 * #curb extensions + 41.19*#speed bumps + 29412.95 * 2 *#bike lanes
- Traffic Light(smart)
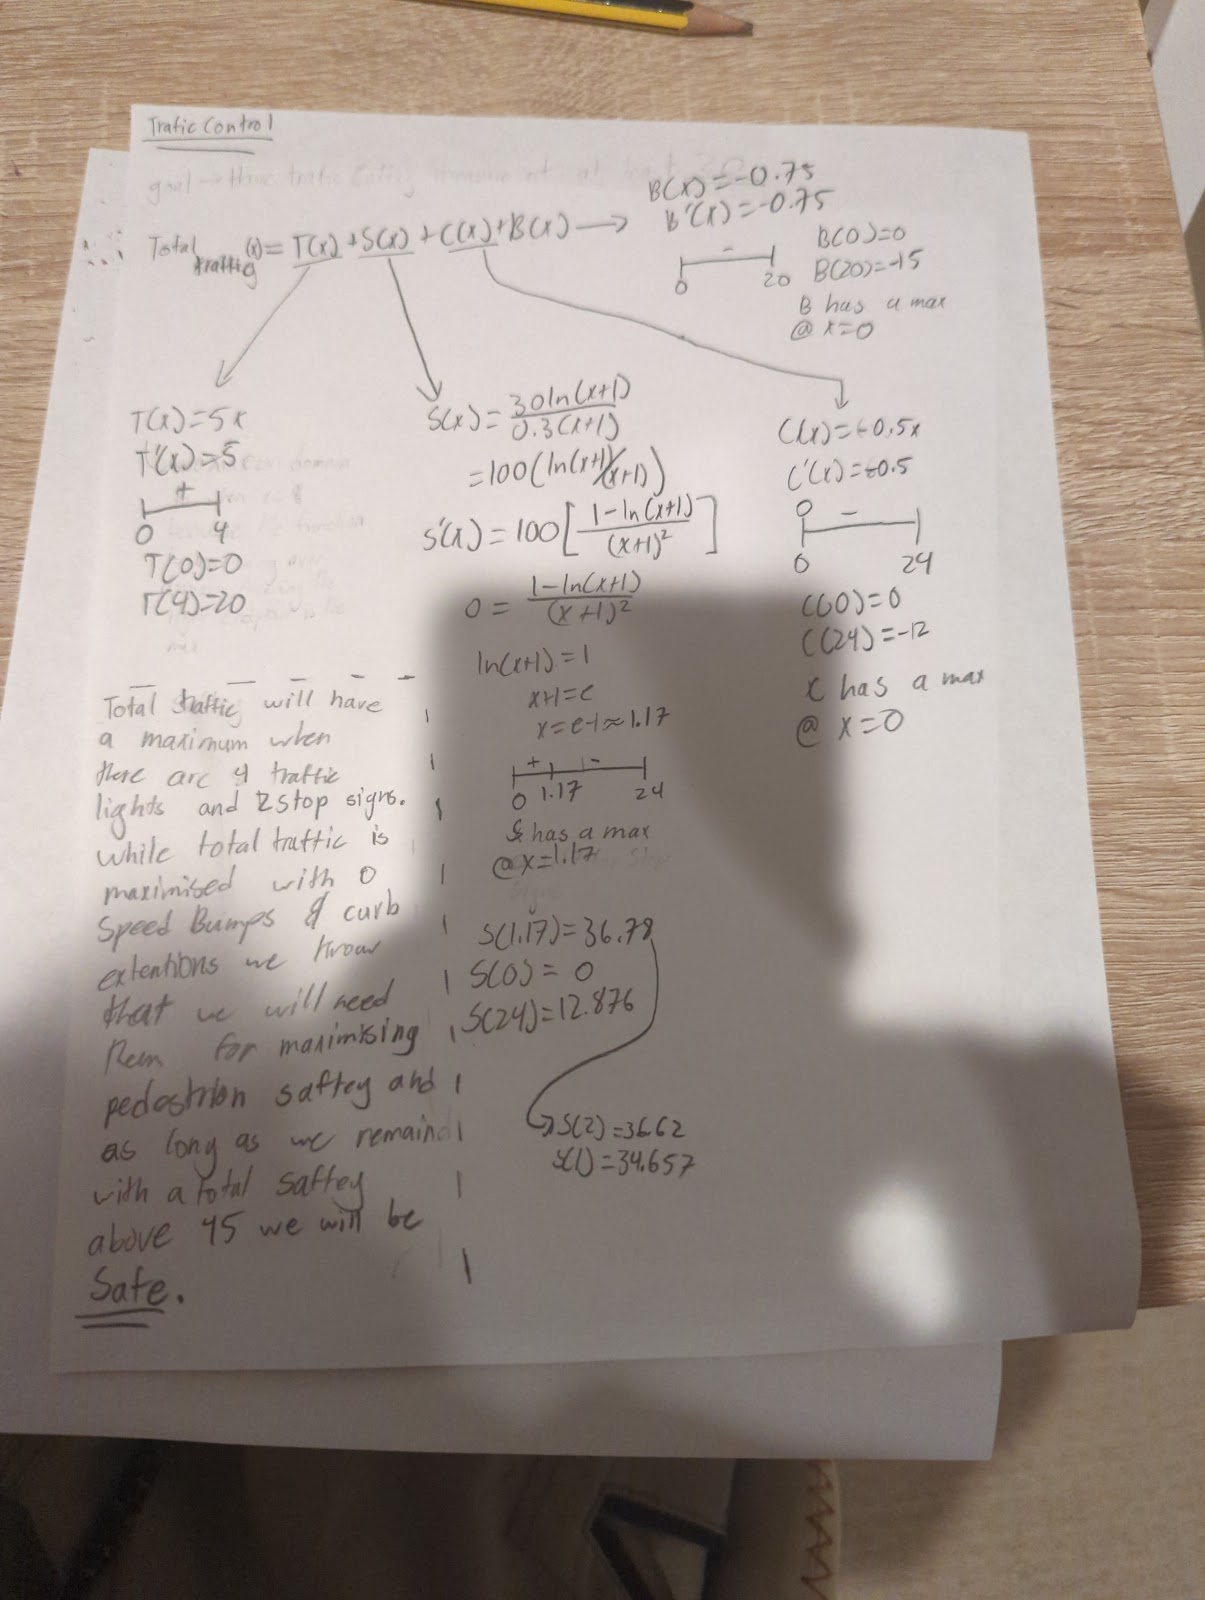
- Traffic Control
- For the purposes of this project we are going to use a made up measure called Standard Traffic Measure which on a scale describes how much something improves(positive) or hurts(negative) traffic control. Each of the methods researched above will have a function which describes how traffic control is affected(y) in relation to the amount of times the method is implemented(x).
- Traffic Signals {x| 0≤x≤4}
- Stop Signs{x| 0≤x≤24}
- Curb Extensions{x| 0≤x≤24}
- Speed Bumps {x| 0≤x≤20}
- Bike Lanes{x| 0≤x≤5}
- Link to graph
- Safety benefits for people
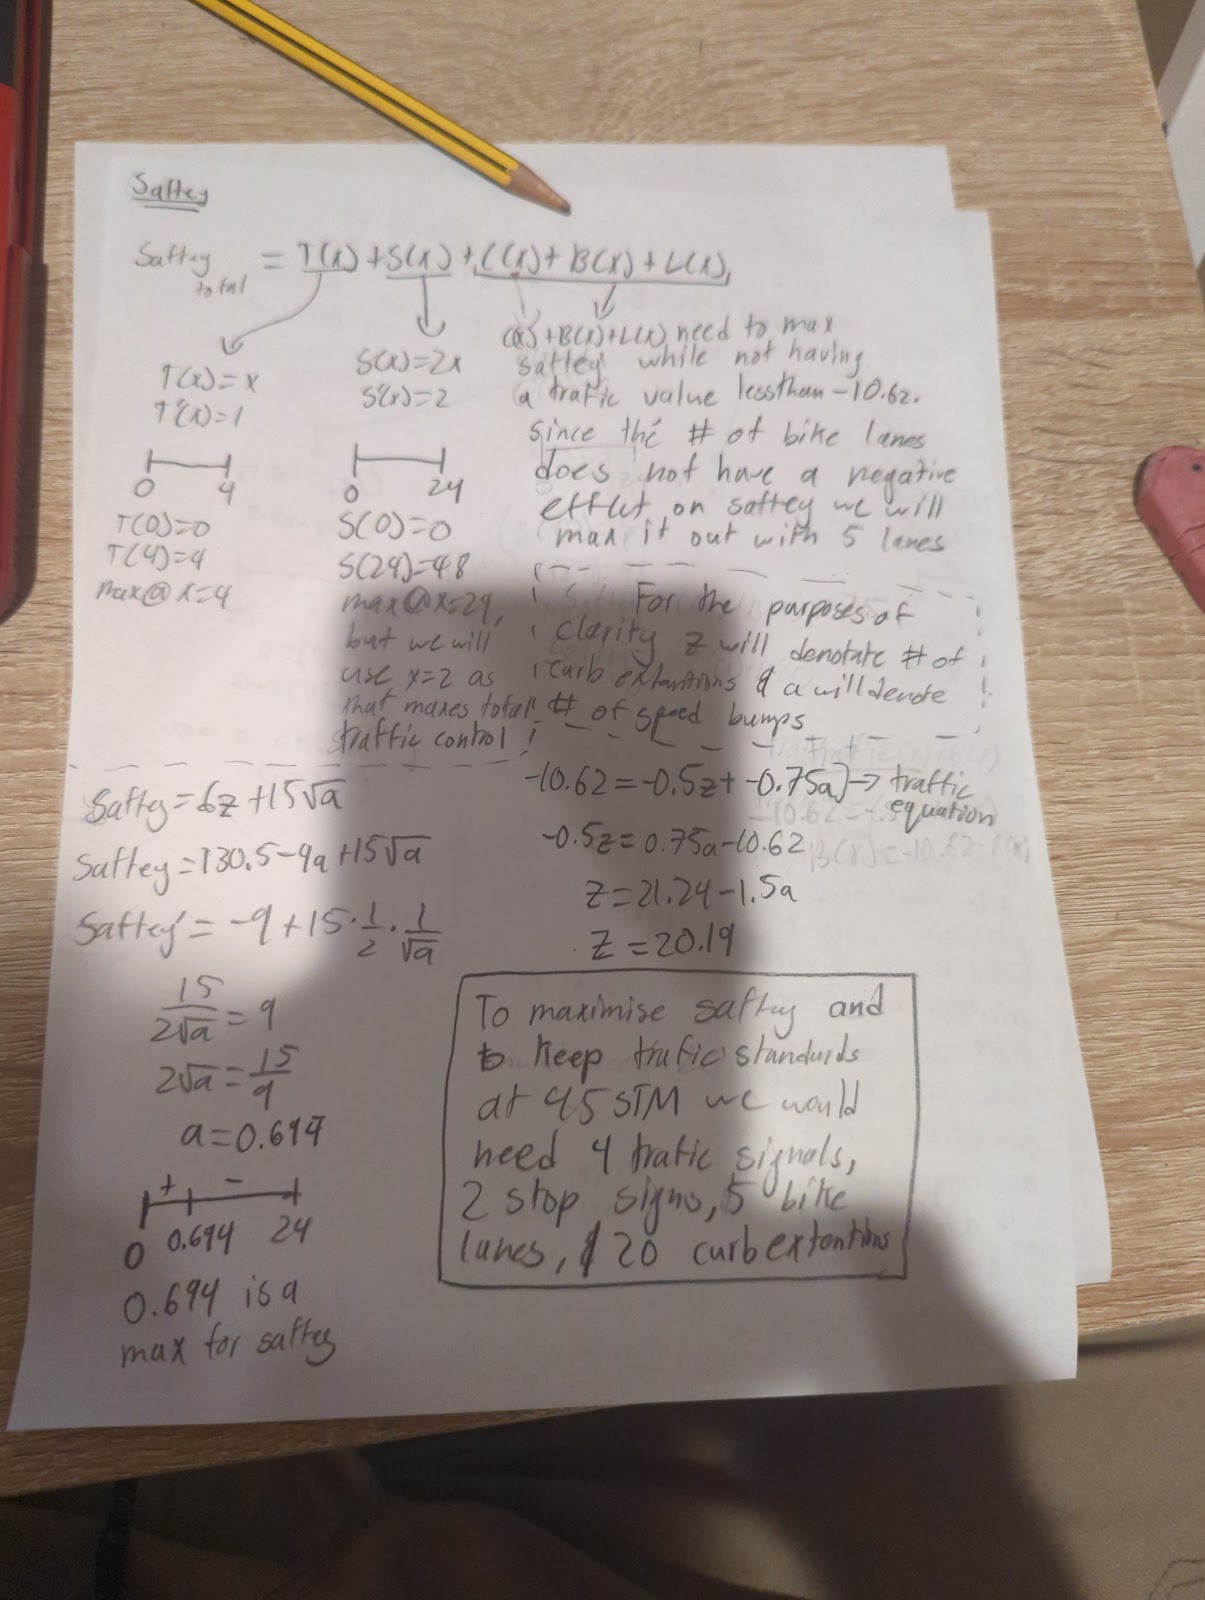
- For the purposes of this project we are going to use a made up measure called Pedestrian Safety Measure which on a scale describes how much something improves pedestrian safety. Each of the methods researched above will have a function which describes how Pedestrian Safety is affected(y) in relation to the amount of times the method is implemented(x).
- Traffic Signals {x| 0≤x≤6}
- Stop Signs{x| 0≤x≤24}
- Curb Extensions{x| 0≤x≤24}
- Speed Bumps {x| 0≤x≤24}
- Bike Lanes{x| 0≤x≤5}
- Link to graph


Mathematical Steps
Finalized Plan
Through our extensive research we have concluded that to construct traffic controls which ensure a high degree of safety and a good flow of traffic we would need 4 traffic signals, 2 stop signs, 5 bike lanes, and 20 curb extensions for a total cost of about 2.5 million dollars.
Some limitations of our project and the conclusions we drew, is that we did not factor in how our model scales with an increased number of people driving. Since our functions for traffic signals and stop signs work linearly, they do not make sense for describing scenarios with large number of people and our guess is that in a more densely populated area our model would fail to achieve a good control of traffic.
Sources
- Initial Proposed Plan
- Data Collection


Leave a comment